若您需要咨询产品或有任何技术问题,请通过官方电话 400 885 9050 或邮箱 info.cn@stemcell.com 与我们联系。

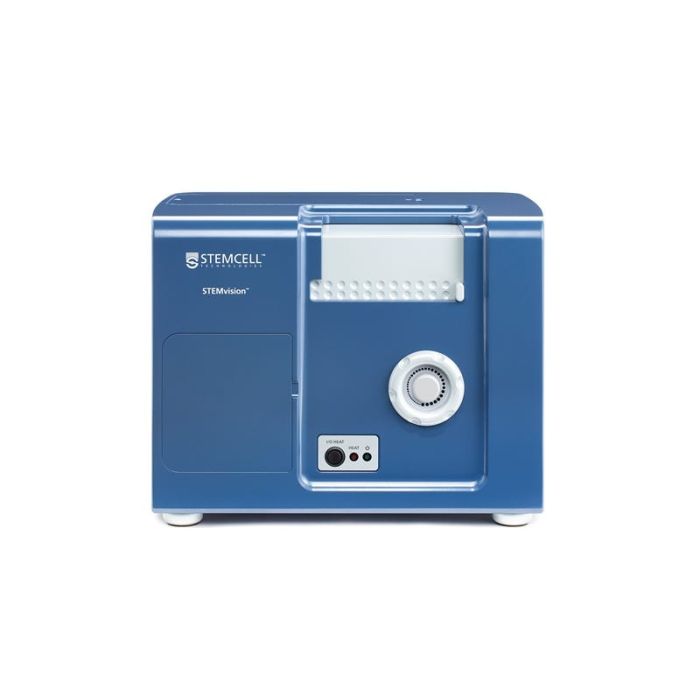
STEMvision™

用于造血集落形成单位(CFU)测定的自动化和标准化集落计数
只有 %1
¥0.00

产品号 #(选择产品)

产品号 #22000_C

用于造血集落形成单位(CFU)测定的自动化和标准化集落计数

Now Available: STEMvision™ 21 CFR Part 11 Compliance Software Add-On (Catalog #500-0110). Request pricing above for more information.
专为您的实验方案打造的产品
要查看实验方案所需的所有配套产品,请参阅《实验方案与技术文档》

What Our Product Engineer Says

We developed STEMvision™ as our own "expert CFU counter in a box" and to remove some of the subjectivity inherent in counting colonies in a CFU assay. Using standardized algorithms helps to reduce variations that might be seen when different people are counting and scoring colonies manually.

Oliver EgelerSenior Systems Engineer
Oliver Egeler, Senior Systems Engineer

总览

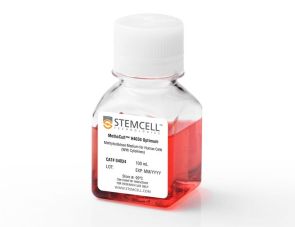
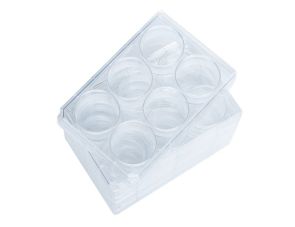
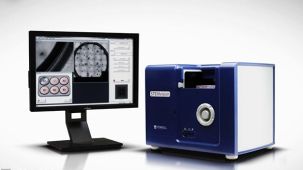
"STEMvision™ 包含一套专门设计的仪器和软件,用于在使用 MethoCult™ 培养基和无弯月面 SmartDish™ 培养皿进行造血集落形成单位 (CFU) 测定时对集落进行成像和计数。STEMvision™ 软件(称为分析包)取代了使用显微镜手动计数集落的需要。通过添加 STEMvision™ 21 CFR 第 11 部分合规软件插件(产品号:500-0110),STEMvision™ 可以支持符合 FDA 第 21 CFR 第 11 部分关于电子记录规定的工作流程。

对于人样本培养,我们设计了三个分析包,用于对在 MethoCult™ Optimum 培养基中培养的 CB、BM 和 MPB 细胞进行 14 天测定时,对红系、髓系和多潜能祖细胞产生的造血集落进行评分和计数。第四种分析包也可用于计数在 MethoCult™ Express 培养基中培养的 CB 7 天测定中的集落总数。

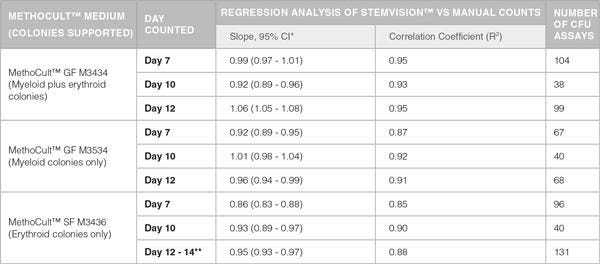
对于小鼠骨髓培养,设计了三种分析包,用于计数 M3434 中所有髓系和红系祖细胞组合、M3534 中仅髓系祖细胞以及 M3436 中仅红系祖细胞产生的造血集落总数。

每台仪器都需要选择至少一个分析包。额外的分析包和支持21 CFR 第 11 部分合规性的软件可以单独订购。选择您喜欢的分析包,然后选择“询价”以了解更多信息。提供多种购买和租赁选项。

有关仪器服务的更多信息,包括附加服务包和安装软件,请参阅我们的 仪器概述 。 

浏览我们的 常见问题(FAQs)进行CFU测定和探索其作为细胞治疗工作流程一部分的实用性 。 

应用
克隆筛选,功能学筛选,基因组编辑
 
品牌
STEMvision
 
研究领域
脐带血库,干细胞生物学,移植研究,细胞治疗开发
 

实验数据

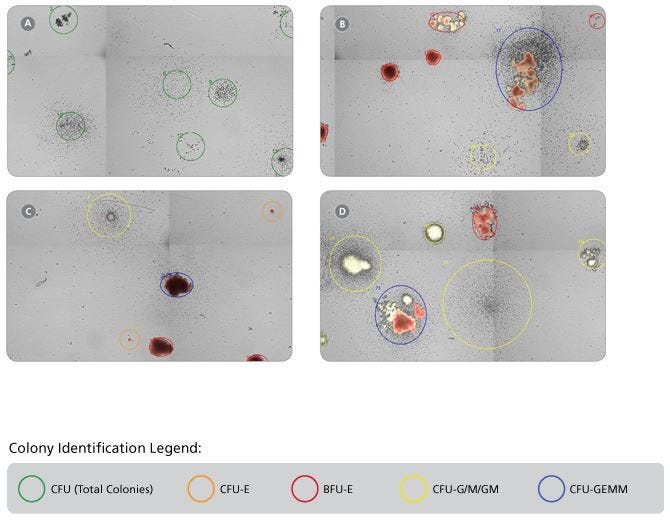
Representative STEMvision™ Images Showing Colonies Derived from CB Progenitors after 7 Days of Culture in MethoCult™ Express, and from CB, BM and MPB after 14 Days of Culture in MethoCult™ Optimum

Figure 1. Representative STEMvision™ Images Showing Colonies Derived from CB Progenitors after 7 Days of Culture in MethoCult™ Express, and from CB, BM and MPB after 14 Days of Culture in MethoCult™ Optimum

These images have been analyzed by STEMvision™ Human (A) 7-Day and (B-D) 14-Day Analysis Packages. Green circles identify individual colonies in a 7-day CB CFU assay that scores total CFUs only (A). Orange and red circles identify erythroid colonies, yellow circles identify myeloid colonies and blue circles identify mixed colonies in 14-day CB (B), BM (C) and MPB (D) CFU assays. Erythroid and mixed colonies that contain hemoglobinized cells are shown in true red color.

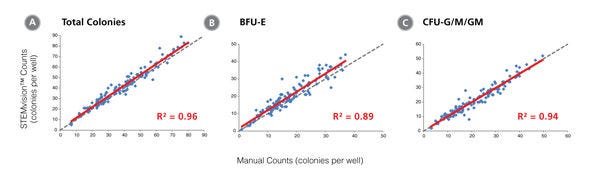
STEMvision™ Automated Counting of Total, Erythroid (BFU-E) and Myeloid (CFU-G/M/GM) Colonies Is Highly Correlated to Manual Counts of 14-Day CB CFU Assays

Figure 2. STEMvision™ Automated Counting of Total, Erythroid (BFU-E) and Myeloid (CFU-G/M/GM) Colonies Is Highly Correlated to Manual Counts of 14-Day CB CFU Assays

Cryopreserved CB cells were thawed, plated in MethoCult™ Optimum and cultured for 14 days. The resulting colonies were then counted both manually using an inverted microscope, and automatically using STEMvision™ with the Human CB 14-Day CFU Analysis Package (Catalog #22005). Gray dashed lines represent a perfect linear correlation between manual and automated counts. Red solid lines represent the actual linear correlation between manual and automated counts. The mathematical equations and correlation coefficients (R2) that describe each data set (n=130 CFU assays) are as follows: A: y=1.02x + 1.39, R2=0.96 for Total Colonies, B: y=1.05x + 1.53, R2=0.89 for BFU-E, C: y=0.99x + 0.13, R2=0.94 for CFU-G/M/GM.

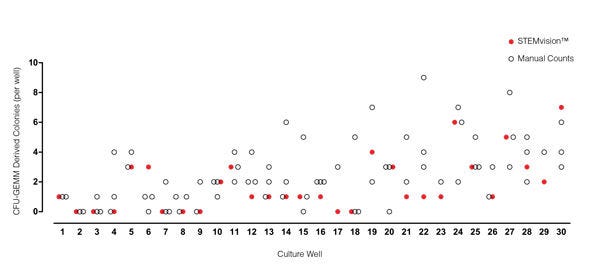
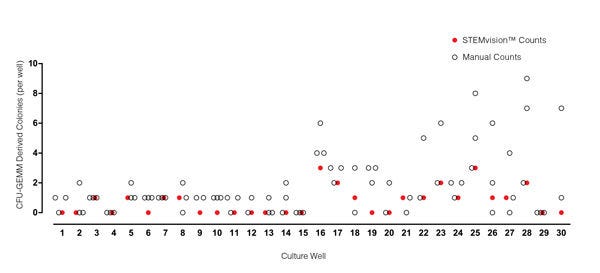
STEMvision™ Automated Counting of Mixed Colonies Falls Within the Range of Manual Counts of 14-Day CB CFU Assays

Figure 3. STEMvision™ Automated Counting of Mixed Colonies Falls Within the Range of Manual Counts of 14-Day CB CFU Assays

Thirty individual 14-day CB CFU assays were counted by three to seven people. The numbers of mixed colonies (CFU-GEMM) colonies counted manually in each well are shown by the black open circles (n=80 total assay scores). Manual CFU-GEMM counts in most cultures varied significantly between individual people. STEMvision™ counts of the same cultures (red circles) provided a CFU-GEMM count that was typically within the range of manual counts.

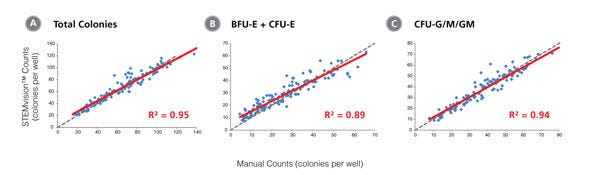
STEMvision™ Automated Scoring of Total, Erythroid (BFU-E + CFU-E) and Myeloid (CFU-G/M/GM) Colonies Is Highly Correlated to Manual Counts of 14-Day BM CFU Assays

Figure 4. STEMvision™ Automated Scoring of Total, Erythroid (BFU-E + CFU-E) and Myeloid (CFU-G/M/GM) Colonies Is Highly Correlated to Manual Counts of 14-Day BM CFU Assays

Cryopreserved BM cells were thawed, plated in MethoCult™ Optimum, cultured for 14 days, and the resulting colonies then scored both manually using an inverted microscope and automatically using STEMvision™ with the Human BM 14-Day CFU Analysis Package (Catalog #22006). The BM Analysis Package can identify and count erythroid colonies produced by CFU-E and BFU-E separately, but these are combined in panel B. Gray dashed lines represent a perfect linear correlation between manual and automated counts. Red solid lines represent the actual linear correlation between manual and automated counts. The mathematical equations and correlation coefficients (R2) that describe each data set (n=120 CFU assays) are as follows: A: y=0.88x + 8.79, R2=0.95 for Total Colonies, B: y=0.83x + 6.71, R2=0.89 for CFU-E + BFU-E, C: y=0.92x + 2.55, R2=0.94 for CFU-G/M/GM.

STEMvision™ Automated Counting of Mixed Colonies Falls Within the Range of Manual Counts of 14-Day BM CFU Assays

Figure 5. STEMvision™ Automated Counting of Mixed Colonies Falls Within the Range of Manual Counts of 14-Day BM CFU Assays

Thirty individual 14-day BM CFU assays were counted by three to seven people. The numbers of mixed (CFU-GEMM) colonies counted manually in each well is shown by the black open circles (n=82 total assay scores). Manual CFU-GEMM counts in most cultures varied significantly between individual people. STEMvision™ counts of the same cultures (red circles) provided a CFU-GEMM count that was typically within the range of manual counts.

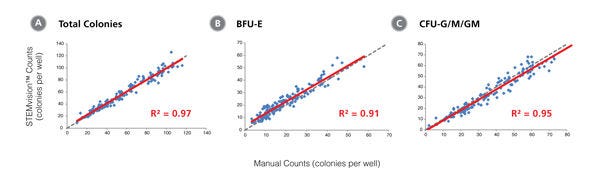
STEMvision™ Automated Counting of Total, Erythroid (BFU-E) and Myeloid (CFU-G/M/GM) Colonies Is Highly Correlated to Manual Counts of 14-Day MPB CFU Assays

Figure 6. STEMvision™ Automated Counting of Total, Erythroid (BFU-E) and Myeloid (CFU-G/M/GM) Colonies Is Highly Correlated to Manual Counts of 14-Day MPB CFU Assays

Cryopreserved MPB cells were thawed, plated in MethoCult™ Optimum, cultured for 14 days, and the resulting colonies then scored both manually using an inverted microscope and automatically using STEMvision™ with the Human MPB 14-Day CFU Analysis Package (Catalog #22007). Gray dashed lines represent a perfect linear correlation between manual and automated counts. Red solid lines represent the actual linear correlation between manual and automated counts. The mathematical equations and correlation coefficients (R2) that describe each data set (n=143 CFU assays) are as follows: A: y=0.97x + 2.44, R2=0.97 for Total Colonies, B: y=0.96x + 3.74, R2=0.91 for BFU-E, C: y=0.96x + 0.90, R2=0.95 for CFU-G/M/GM.

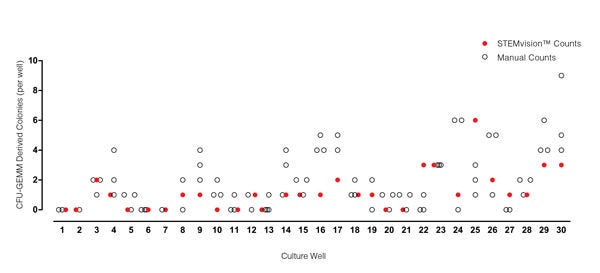
STEMvision™ Automated Scoring of Mixed Colonies Falls Within the Range of Manual Counts of 14-Day MPB CFU Assays

Figure 7. STEMvision™ Automated Scoring of Mixed Colonies Falls Within the Range of Manual Counts of 14-Day MPB CFU Assays

Thirty individual 14-day MPB CFU assays were counted by three to seven people. The numbers of mixed (CFU-GEMM) colonies counted manually in each well is shown by the black open circles (n=82 total assay scores). Manual CFU-GEMM counts in most cultures varied significantly between individual people. STEMvision™ counts of the same cultures (red circles) provided a CFU-GEMM count that was typically within the range of manual counts.

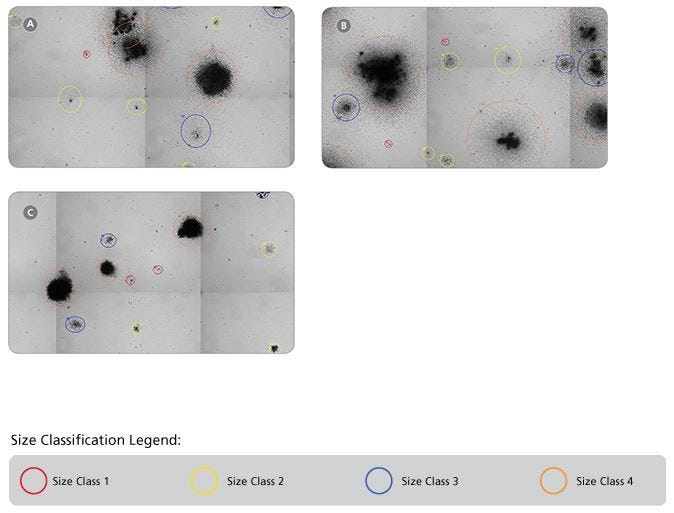
Representative STEMvision™ Images Showing Colonies Derived from Mouse BM Progenitors After 12 Days of Culture in MethoCult™ GF M3434, MethoCult™ GF M3534 or MethoCult™ SF M3436 Media

Figure 8. Representative STEMvision™ Images Showing Colonies Derived from Mouse BM Progenitors After 12 Days of Culture in MethoCult™ GF M3434, MethoCult™ GF M3534 or MethoCult™ SF M3436 Media

Images of mouse BM cells cultured in (A) MethoCult™ GF M3434, (B) MethoCult™ GF M3534 and (C) MethoCult™ SF M3436 were acquired using STEMvision™. The corresponding STEMvision™ Mouse Analysis Package (Table 1) was used to analyze each image. Red circles identify the smallest colonies - size class 1, yellow circles - size class 2, blue circles - size class 3 and orange circles identify the largest colonies - size class 4.

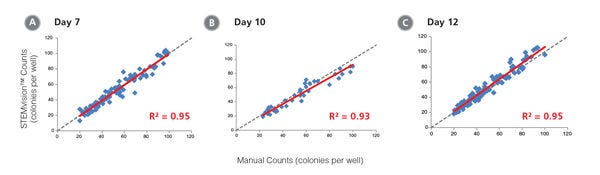
STEMvision™ Automated Counting is Highly Correlated to Manual Counting of Total (Myeloid Plus Erythroid) Colonies in Mouse BM CFU Assays

Figure 9. STEMvision™ Automated Counting is Highly Correlated to Manual Counting of Total (Myeloid Plus Erythroid) Colonies in Mouse BM CFU Assays

BM cells were plated in MethoCult™ GF M3434 (Catalog #03434/03444). Colonies were counted on days (A) 7, (B) 10 and (C) 12 both manually using an inverted microscope, and automatically using STEMvision™ equipped with the Mouse Total CFU Analysis Package (Catalog #22008). We recommend counting CFU assays of mouse progenitor cells plated in M3434 between 10 and 12 days. Gray dashed lines represent a theoretical perfect linear correlation between manual and automated counts. Red solid lines represent the actual linear correlation between manual and automated counts. The slope, 95% confidence intervals, correlation coefficients (R2) and sample size for each data set are provided in Table 1.

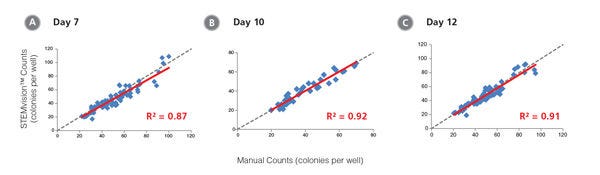
STEMvision™ Automated Counting is Highly Correlated to Manual Counting of Myeloid Colonies in Mouse BM CFU Assays

Figure 10. STEMvision™ Automated Counting is Highly Correlated to Manual Counting of Myeloid Colonies in Mouse BM CFU Assays

BM cells were plated in MethoCult™ GF M3534 (Catalog #03534). Colonies were counted on days (A) 7, (B) 10 and (C) 12 both manually using an inverted microscope, and automatically using STEMvision™ equipped with the Mouse Myeloid CFU Analysis Package (Catalog #22009). We recommend counting CFU assays of mouse myeloid progenitor cells plated in M3534 between 10 and 12 days. Gray dashed lines represent a theoretical perfect linear correlation between manual and automated counts. Red solid lines represent the actual linear correlation between manual and automated counts. The slope, 95% confidence intervals, correlation coefficients (R2) and sample size for each data set are provided in Table 1.

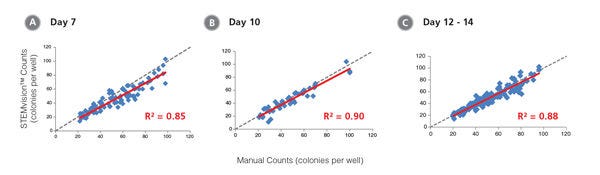
STEMvision™ Automated Counting is Highly Correlated to Manual Counting of Erythroid Colonies in Mouse BM CFU Assays

Figure 11. STEMvision™ Automated Counting is Highly Correlated to Manual Counting of Erythroid Colonies in Mouse BM CFU Assays

BM cells were plated in MethoCult™ SF M3436 (Catalog #03436). Colonies were counted on days (A) 7, (B) 10 and (C) 12 - 14 both manually using an inverted microscope, and automatically using STEMvision™ equipped with the Mouse Erythroid CFU Analysis Package (Catalog #22011). We recommend counting CFU assays of mouse erythroid progenitor cells plated in M3436 between of 10 to 14 days. Gray dashed lines represent a theoretical perfect linear correlation between manual and automated counts. Red solid lines represent the actual linear correlation between manual and automated counts. The slope, 95% confidence intervals, correlation coefficients (R2) and sample size for each data set are provided in Table 1.

Table 1. Correlation Between Automated STEMvision™ and Manual Colony Counting

Table 1. Correlation Between Automated STEMvision™ and Manual Colony Counting

*CI: Confidence Internal
**Mouse CFU assays of erythroid progenitor cells plated in M3436 should be counted between 10 to 14 days.

产品说明书及文档

请在《产品说明书》中查找相关支持信息和使用说明,或浏览下方更多实验方案。

Document Type
Product Name
Catalog #
Lot #
Language
Document Type
Technical Manual
Product Name
STEMvision™
Catalog #
22000
Lot #
All
Language
English

应用领域

本产品专为以下研究领域设计,适用于工作流程中的高亮阶段。探索这些工作流程,了解更多我们为各研究领域提供的其他配套产品。
相关材料与文献

技术资料 (25)

文献 (23)

RHEX, a novel regulator of human erythroid progenitor cell expansion and erythroblast development. Verma R et al. The Journal of experimental medicine 2014 AUG

Abstract

Ligation of erythropoietin (EPO) receptor (EPOR) JAK2 kinase complexes propagates signals within erythroid progenitor cells (EPCs) that are essential for red blood cell production. To reveal hypothesized novel EPOR/JAK2 targets,a phosphotyrosine (PY) phosphoproteomics approach was applied. Beyond known signal transduction factors,32 new targets of EPO-modulated tyrosine phosphorylation were defined. Molecular adaptors comprised one major set including growth factor receptor-bound protein 2 (GRB2)-associated binding proteins 1-3 (GAB1-3),insulin receptor substrate 2 (IRS2),docking protein 1 (DOK1),Src homology 2 domain containing transforming protein 1 (SHC1),and sprouty homologue 1 (SPRY1) as validating targets,and SPRY2,SH2 domain containing 2A (SH2D2A),and signal transducing adaptor molecule 2 (STAM2) as novel candidate adaptors together with an ORF factor designated as regulator of human erythroid cell expansion (RHEX). RHEX is well conserved in Homo sapiens and primates but absent from mouse,rat,and lower vertebrate genomes. Among tissues and lineages,RHEX was elevated in EPCs,occurred as a plasma membrane protein,was rapidly PY-phosphorylated textgreater20-fold upon EPO exposure,and coimmunoprecipitated with the EPOR. In UT7epo cells,knockdown of RHEX inhibited EPO-dependent growth. This was associated with extracellular signal-regulated kinase 1,2 (ERK1,2) modulation,and RHEX coupling to GRB2. In primary human EPCs,shRNA knockdown studies confirmed RHEX regulation of erythroid progenitor expansion and further revealed roles in promoting the formation of hemoglobinizing erythroblasts. RHEX therefore comprises a new EPO/EPOR target and regulator of human erythroid cell expansion that additionally acts to support late-stage erythroblast development.
An Efficient Electroporation Protocol for the Genetic Modification of Mammalian Cells. L. Chicaybam et al. Frontiers in bioengineering and biotechnology 2016

Abstract

Genetic modification of cell lines and primary cells is an expensive and cumbersome approach,often involving the use of viral vectors. Electroporation using square-wave generating devices,like Lonza's Nucleofector,is a widely used option,but the costs associated with the acquisition of electroporation kits and the transient transgene expression might hamper the utility of this methodology. In the present work,we show that our in-house developed buffers,termed Chicabuffers,can be efficiently used to electroporate cell lines and primary cells from murine and human origin. Using the Nucleofector II device,we electroporated 14 different cell lines and also primary cells,like mesenchymal stem cells and cord blood CD34+,providing optimized protocols for each of them. Moreover,when combined with sleeping beauty-based transposon system,long-term transgene expression could be achieved in all types of cells tested. Transgene expression was stable and did not interfere with CD34+ differentiation to committed progenitors. We also show that these buffers can be used in CRISPR-mediated editing of PDCD1 gene locus in 293T and human peripheral blood mononuclear cells. The optimized protocols reported in this study provide a suitable and cost-effective platform for the genetic modification of cells,facilitating the widespread adoption of this technology.
Myelo-lymphoid lineage restriction occurs in the human haematopoietic stem cell compartment before lymphoid-primed multipotent progenitors. S. Belluschi et al. Nature communications 2018

Abstract

Capturing where and how multipotency is lost is crucial to understand how blood formation is controlled. Blood lineage specification is currently thought to occur downstream of multipotent haematopoietic stem cells (HSC). Here we show that,in human,the first lineage restriction events occur within the CD19-CD34+CD38-CD45RA-CD49f+CD90+ (49f+) HSC compartment to generate myelo-lymphoid committed cells with no erythroid differentiation capacity. At single-cell resolution,we observe a continuous but polarised organisation of the 49f+ compartment,where transcriptional programmes and lineage potential progressively change along a gradient of opposing cell surface expression of CLEC9A and CD34. CLEC9AhiCD34lo cells contain long-term repopulating multipotent HSCs with slow quiescence exit kinetics,whereas CLEC9AloCD34hi cells are restricted to myelo-lymphoid differentiation and display infrequent but durable repopulation capacity. We thus propose that human HSCs gradually transition to a discrete lymphoid-primed state,distinct from lymphoid-primed multipotent progenitors,representing the earliest entry point into lymphoid commitment.
质量保证:

产品仅供研究使用,不用于针对人或动物的诊断或治疗。 欲获悉更多关于STEMCELL的质控信息,请访问 STEMCELL.CN/COMPLIANCE.
Copyright © 2026 by STEMCELL Technologies. All rights reserved.

在线联系